
The first phase of the Ridgeway Portal was completed in 2025
In the first year of the Ridgeway portal our incredible team of volunteers mapped 8916 relict field boundaries and 460 other features of interest from the lidar data. You can read more about it in the report from volunteer Simon below. Work is currently paused but the project team has plans for an expansion and new projects in 2026-7.
Ridgeway Lidar project – field mapping
Simon Cains
The volunteers were taken through a training course on Lidar basics, using the mapping portal, and identifying historical features. We were first set a task of digitising any straight field boundaries on the Lidar data, with no attempt to apply any dating or classification. This was a way to introduce the volunteers to the principles of Lidar, and to using the mapping system, before we would move onto the more “exciting” features such as neolithic burial mounds, hill forts etc. We were specifically looking for raised boundary banks, some of which may have been the remains of hedgerows, showing up as white on the Lidar local relief model.
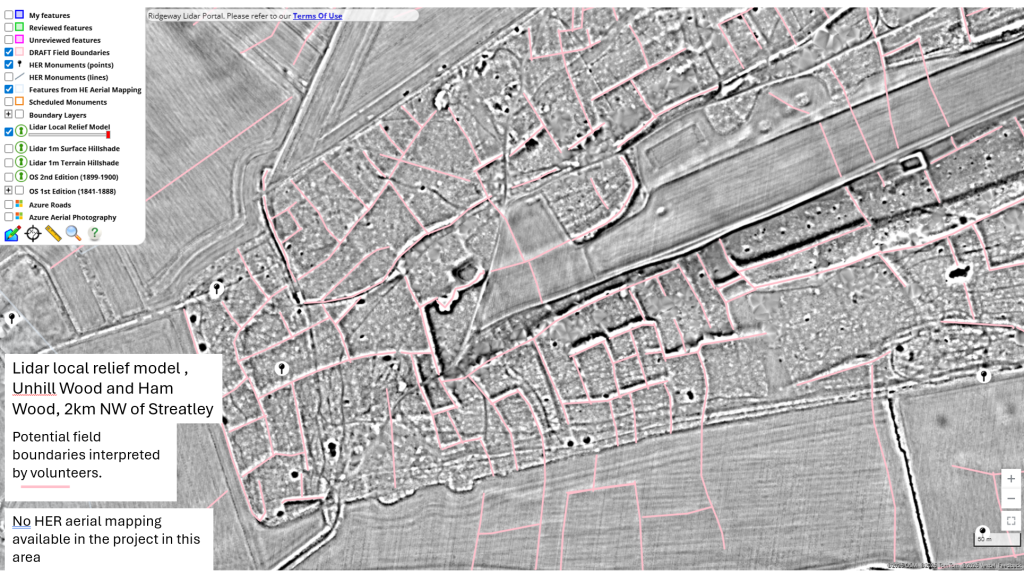
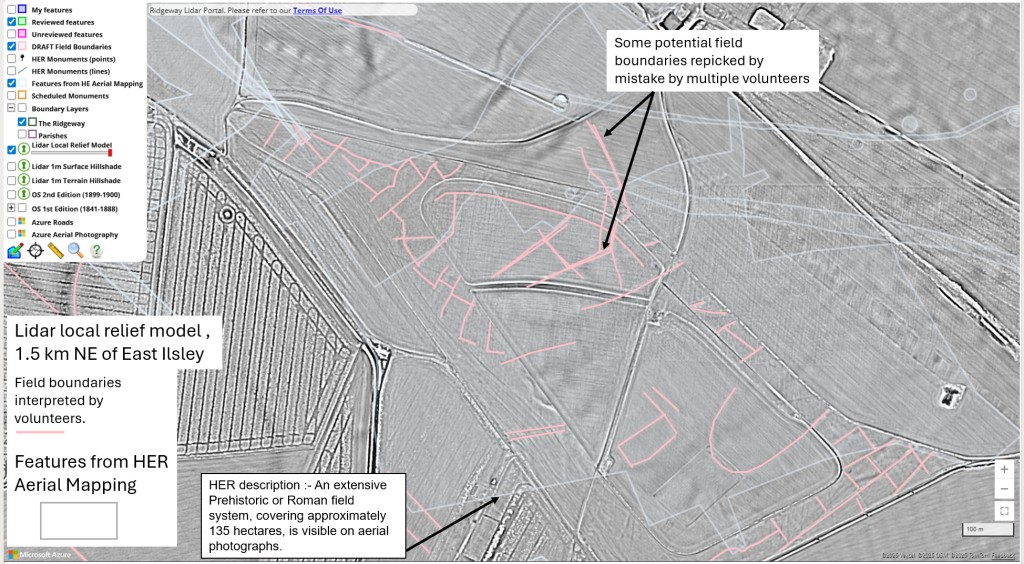
However, this first phase of field mapping has perhaps added most to the known historical database of the study area. (The important archaeological features have been recognised by archaeologists and on the old Ordnance survey maps). Some of the areas of fields have been identified on the Historic England aerial survey but just as a confused set of overlapping polygons, or as single points with a description. These low-relief lost field boundaries are nearly invisible on aerial photos or are hidden in the woods. This project may be the first detailed mapping of every potential field.
A few of the volunteers then acted as reviewers, to decide which of the picked lines did seem to be genuine field boundaries, or were probably something else, e.g. pipelines, tracks, ploughmarks, rainwater gullies, individual furrows in a ridge and furrow system etc etc. The figures shown below have all the interpreted field boundaries, before the review process.
During the project we had regular video meetings with Rebecca, and she could show us features live on the mapping system and talk about areas that we highlighted. We also used Discord to chat to Rebecca and each other, including posting pictures of odd things. “What is this ?”.
In the woodland
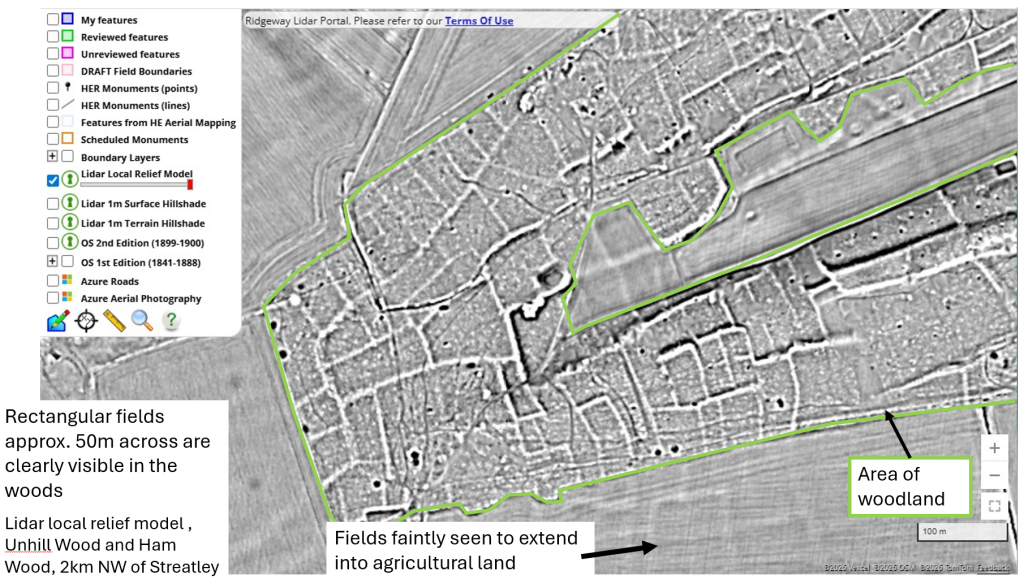
Field boundaries within later woodland were generally sharp and clear, easy to spot, although Lidar data in woodland tends to be more noisy due to some spots on the ground being hidden by trees, but there was also some confusion with forest works, tracks and footpaths and other activity. And of course we could not see anything on the aerial view to help interpret these features, but we could compare them to the old OS maps in the project.
Farmed land
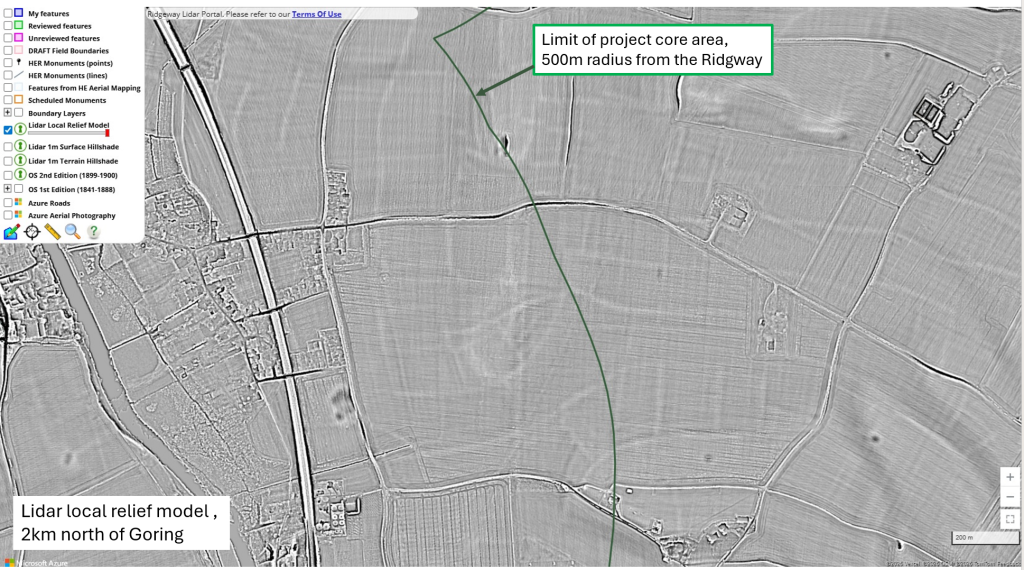
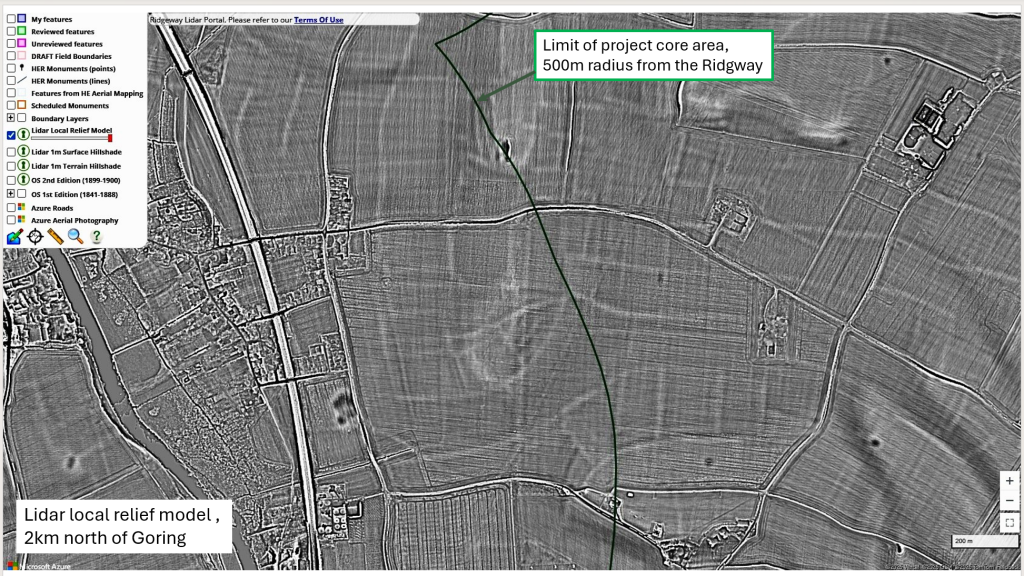
Former field boundaries in agricultural land were of course degraded to varying extents by centuries of ploughing. Sometimes a boundary in woodland could be directly traced into the open fields. The field boundary banks will have been smeared out by ploughing, becoming broad and faint, often near the limit of visibility on the Lidar data. I sometimes found it useful to take a screenshot and enhance it in a photo package, increasing the contrast and make it slightly darker.
So for a project looking specifically for these faint features, I would recommend increasing the Lidar contrast, even if that means over-exposing the brighter features (which are probably modern). Perhaps give the volunteers a second higher-contrast image to choose, or even have a contrast adjustment control, to vary the display as they wish.
Other landuses – racehorse training
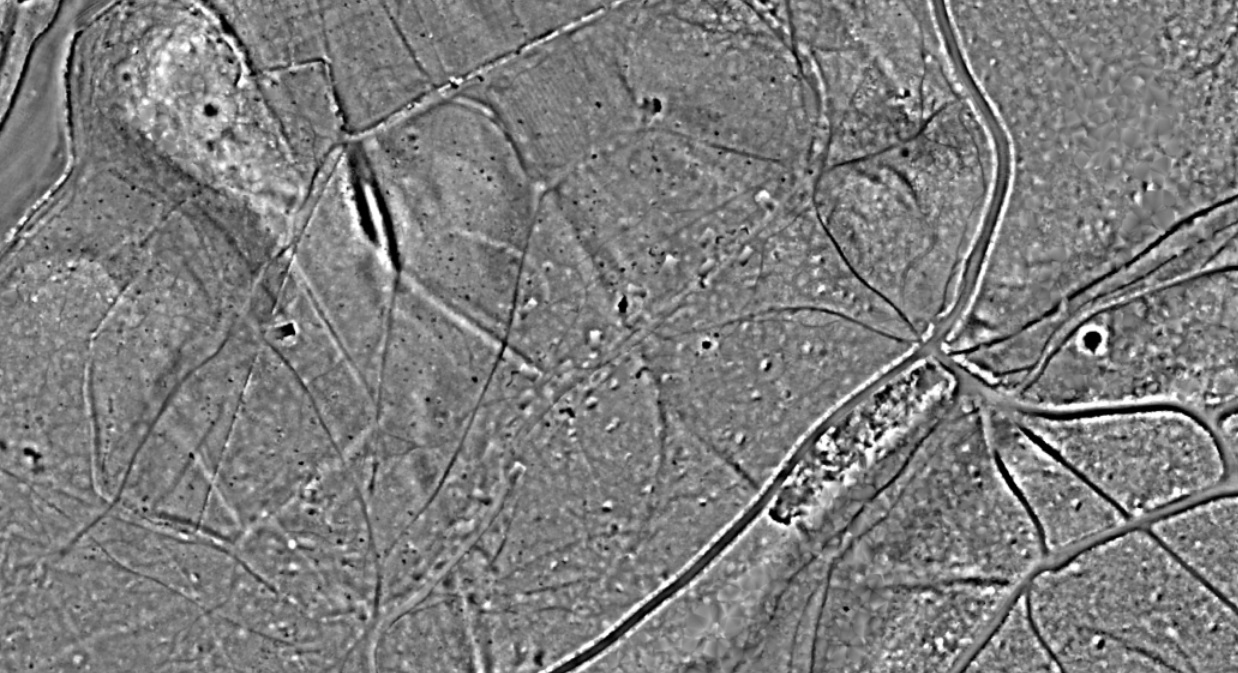
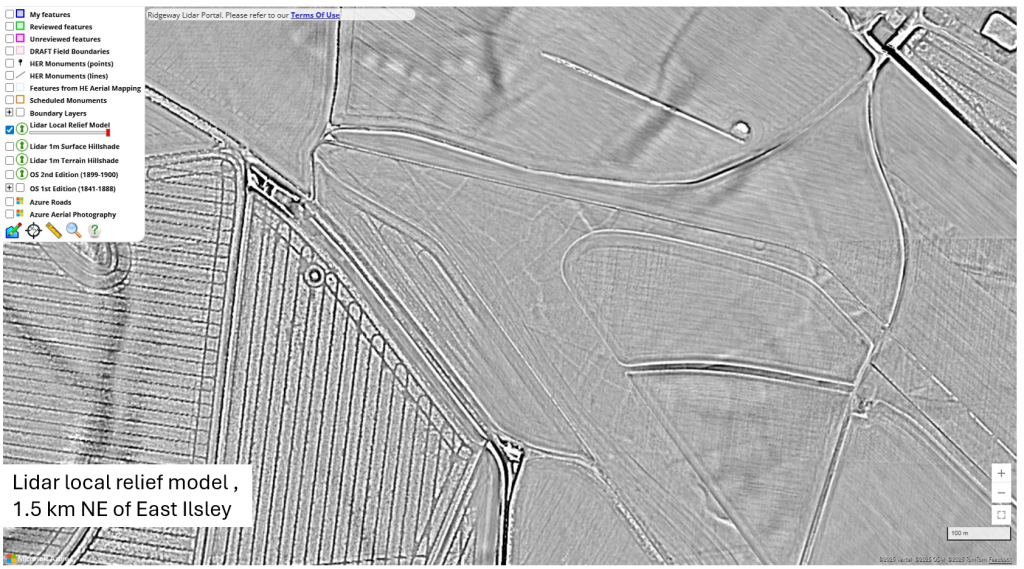
Parts of our study area were extensively used for racehorse training, the land was made into racehorse gallops, which gave some misleading features and hid the field boundaries. On the pictures below there is just a thin sliver of surviving fields running NW to SE around the gallops and ploughed fields. The Historic England aerial feature polygons confirm these are Roman or prehistoric field systems, but their mapped areas are confusing and overlapping.
Not ancient but important
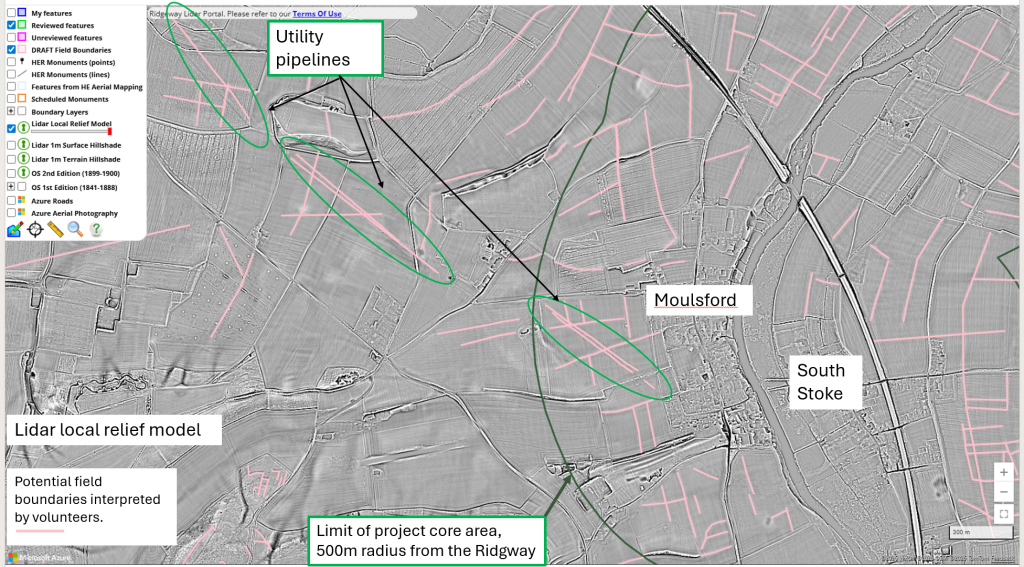
We also “discovered” several pipelines crossing the area, presumably gas, water, electricity etc. There don’t seem to be any detailed publicly-available maps of utilities to check these, perhaps for national security reasons. Instead we looked at the historical imagery on google earth pro (free) where sometimes we could see an obvious trench on the year it was laid, then it softening over time. Another trick was to use google streetview, where a pipeline crosses a road there will be a red and white pole and sometimes a warning notice.
There are faint pipelines running from NW to SE right across this picture, starting at the “Ridgeway Lidar Portal” top left. One archaeological report did give a map of the pipeline that they were working on.
Google Earth also showed a large area of temporary roads, which were for erecting a new set of electricity pylons, and still showed faintly on the Lidar.
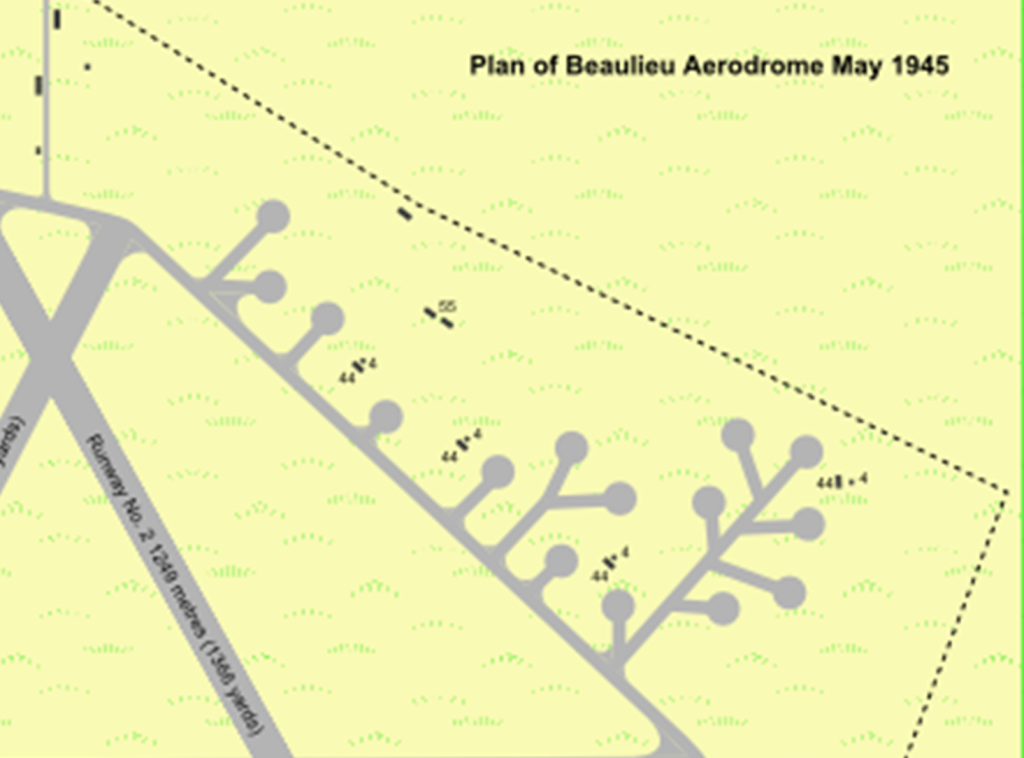
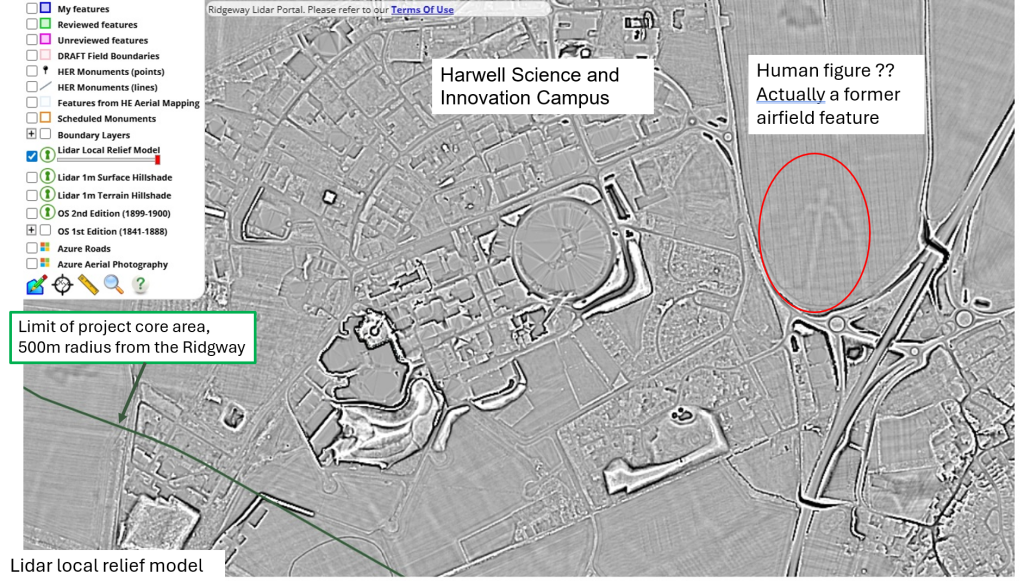
Perhaps the most intriguing feature we spotted seemed to be a human figure, on the right-hand side of this picture, but unlike any early art forms. ( A sign of alien visitors ?). It was finally identified as a set of dispersal points for the wartime RAF airfield, to park individual aircraft rather than be crowded together giving a target for enemy bombers.
The large circle in the centre of the picture is the Diamond Light X-ray source, one of the most powerful in the world, the latest high technology sitting just outside this historic Ridgeway landscape.